In a big step forward for nonmotorized planning, a dashboard with bike data from the Washington, D.C. metro area is coming to BikePed Portal. Previously, a planner looking to see the latest biking numbers for the nation’s capital would have to look at info from several jurisdictions, including Arlington County, the City of Alexandra, the District Department of Transportation, Fairfax County, Montgomery County, and the National Park Service, which manages counters on several trails and natural areas in the greater metro area.
Now, with funding from a National Park Service (NPS) Cooperative Ecosystem Studies Unit (CESU), a unique program that facilitates partnerships between federal and non-federal entities and research institutions, Virginia Tech and the University of North Carolina Highway Safety Research Center (HSRC) are teaming up with data specialists at Portland State University (PSU) to create a new dashboard that will allow users to see all the D.C. bike data together in one place.
Housed at PSU’s Transportation Research and Education Center (TREC), BikePed Portal is a centralized repository that contains biking and walking count data from places all over the United States. It aims to be a one-stop shop for transportation professionals looking for clean, quality-checked, ready-to-use nonmotorized data.
DEVELOPING A DASHBOARD FOR THE DC AREA
The Washington D.C. metro area’s dashboard is currently being developed at PSU, co-led by TREC’s associate director, Hau Hagedorn, and transportation data program manager Tammy Lee, and should be available for use sometime in the coming year.
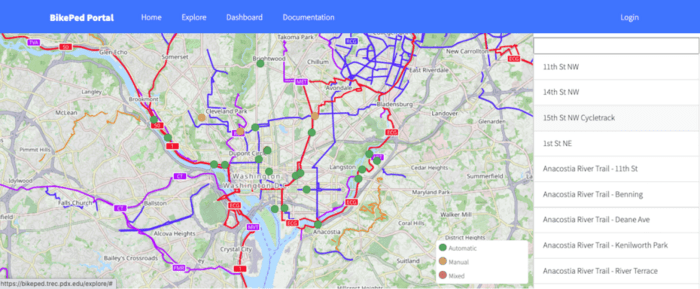
Some of D.C.’s data is, in fact, already in BikePed Portal (as the image at the top shows). For a user to see all of it, however, they have to switch between different views. BikePed Portal hosts data from Maryland, Virginia, and D.C., but when a user views D.C., they are not able to see the data from Maryland and Virginia that are in the same metro area. This type of jurisdictional sprawl is common when it comes to nonmotorized data.
“It’s really a lot of people that come together at the table to sort of organize, especially in such a very dense location. So we’re working with all these stakeholders to put all their data in one centralized repository. Instead of having to say, you know, ‘Hey, share your data with us,’ or ‘Can we share our data with you?’ Instead, it’s all in one central location where everybody has access to each other’s data,” Lee said.
Krista Nordback, senior research associate at UNC HSRC, is managing the project on the HRSC’s end and says it is one of the “most exciting” she’s worked on. She was instrumental in creating BikePed Portal while working as a research associate at PSU, back in 2014 when it was first launched with funding from the National Institute for Transportation and Communities (NITC). So she was already aware of BikePed Portal as a growing resource for nationwide bike counts, when the NPS broached the subject of creating a dashboard for DC. Rather than reinvent the wheel, Nordback suggested bringing PSU into the project.
Arlington County’s bike education and encouragement program, BikeArlington, had originally created its own dashboard showing data from Arlington counters. They hoped to turn it into something more comprehensive, and combining their resources with BikePed Portal seemed like the way to go.
“The point is, there are a lot of counters. They’re all owned by different people. They’re managed by different people. Sometimes they collaborate. We’re trying to help get them better data, and part of that’s maintenance. Part of it’s quality checking and basic validation. So we’re starting to get there. As a user, instead of having to go to three different places in BikePed Portal, I want to have one view where I can see all of it,” Nordback said.
As the dashboard is being developed, Virginia Tech students are gaining valuable experience – experiential learning for university students is a top priority of the NPS CESU programs – by testing, maintaining, and quality-checking the bike-ped counters in the area.
DATA VALIDATION AT VIRGINIA TECH
Virginia Tech Professors Ralph Buehler and Steve Hankey are managing several classes of students working on the project in various capacities. In Fall 2021, a graduate planning studio course kicked it off by analyzing 19 NPS counters on four trail systems (Anacostia River Trail, Capital Crescent Trail, C&O Canal, and the Mount Vernon Trail) to identify discrepancies in the data. Their final report provided recommendations for where new counters should be located.
Currently, masters student Shazalal Tushar is conducting physical maintenance on the counters that need attention, and has also set up video cameras at several counter sites. Two undergraduate students, Monica Perez and Maggie Gibbon, are working on validating the counters’ data by comparing it with the video feed. The team will then develop correction equations to account for the discrepancies. Soon, a PhD student at Virginia Tech will join the team to conduct research for a dissertation focused around this project.
Cleaning up data from the NPS counters is only part of the story, though. The next part was getting buy-in from the regional partners.
“The National Park Service has trails running through and connecting different parts of the region, and they have placed counters on their trails. So part of the project is to get us to work with their data and validate their counters. And then the hope was that other jurisdictions would sort of start opting in, and also add their own counters to become part of that network. So it’s sort of a Federal effort on the local level,” Buehler said.
If the effort seems piecemeal, that’s because it is. While data on the motorized side has been dialed in for decades – cars are counted via standardized methods, and agencies have less difficulty accessing information about where people are driving – the world of nonmotorized data is evolving rapidly, and unevenly. Part of the challenge lies in the fact that every large metropolitan area has more than one jurisdiction involved. Steven Hankey sees similarities and differences in how each city addresses this difficulty.
“Every place has a different project champion stepping up. And then that entity ends up driving what [data management] looks like for the area. For example, in Minnesota, it ended up being MNDOT, the state agency. And so that became more of a statewide program. This project is part of DC’s story, and in many ways I think it’s fair to say that the story is still unfolding,” Hankey said.
In order to support better bicycle and pedestrian infrastructure, policymakers and planners need accurate data on how many people are biking and walking. BikePed Portal provides a centralized, standard database for public agencies, researchers, educators, and other curious members of the public. The website allows users to explore annual, monthly, daily, and hourly pedestrian and bicycle volumes at over 600 locations across the country (and growing).
In addition to hosting data to make it centrally available, the BikePed Portal team at PSU develops applications to help planners and other professionals get the most out of their data, such as an AADNT (average annual daily nonmotorized traffic) count tool, and basic automated quality checks. Currently under development is an annotation function, which will allow users to flag data that’s been impacted by events such as marathons that increase bike/ped traffic, weather like big snow snow storms that could decrease bike/ped traffic, known counter malfunctions or vandalism incidents, and trail closures.
SEE RELATED RESEARCH
- Biking and Walking Quality Counts: Using “BikePed Portal” Counts to Develop Data Quality Checks
- BikePed Portal Phase II
- Exploring Data Fusion Techniques to Estimate Network-Wide Bicycle Volumes
Portland State University’s Transportation Research and Education Center (TREC) is home to the U.S. DOT funded National Institute for Transportation and Communities (NITC), the Initiative for Bicycle and Pedestrian Innovation (IBPI), PORTAL, BikePed Portal and other transportation grants and programs. We produce impactful research and tools for transportation decision makers, expand the diversity and capacity of the workforce, and engage students and professionals through education and participation in research.